Visualizations, Benchmarks, and Indices
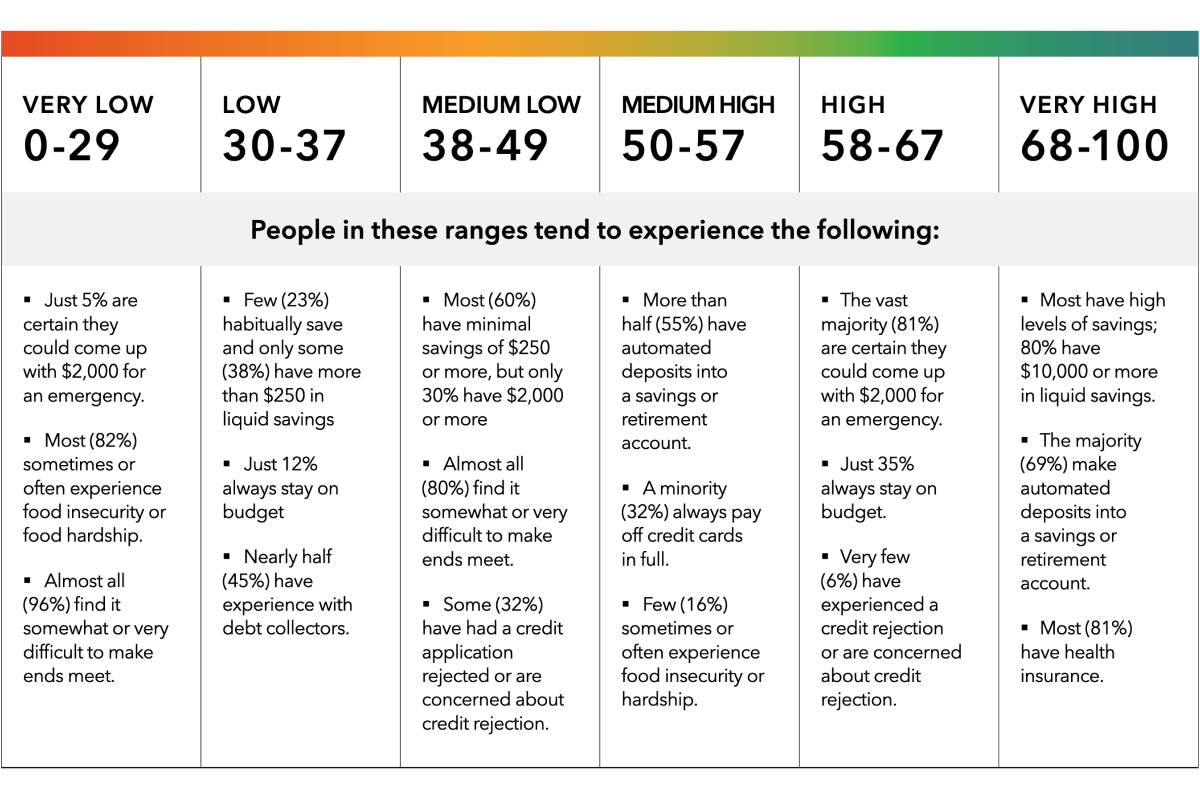
These examples demonstrate Abt's ability to engage audiences through interactive data visualizations and creative presentation of data.
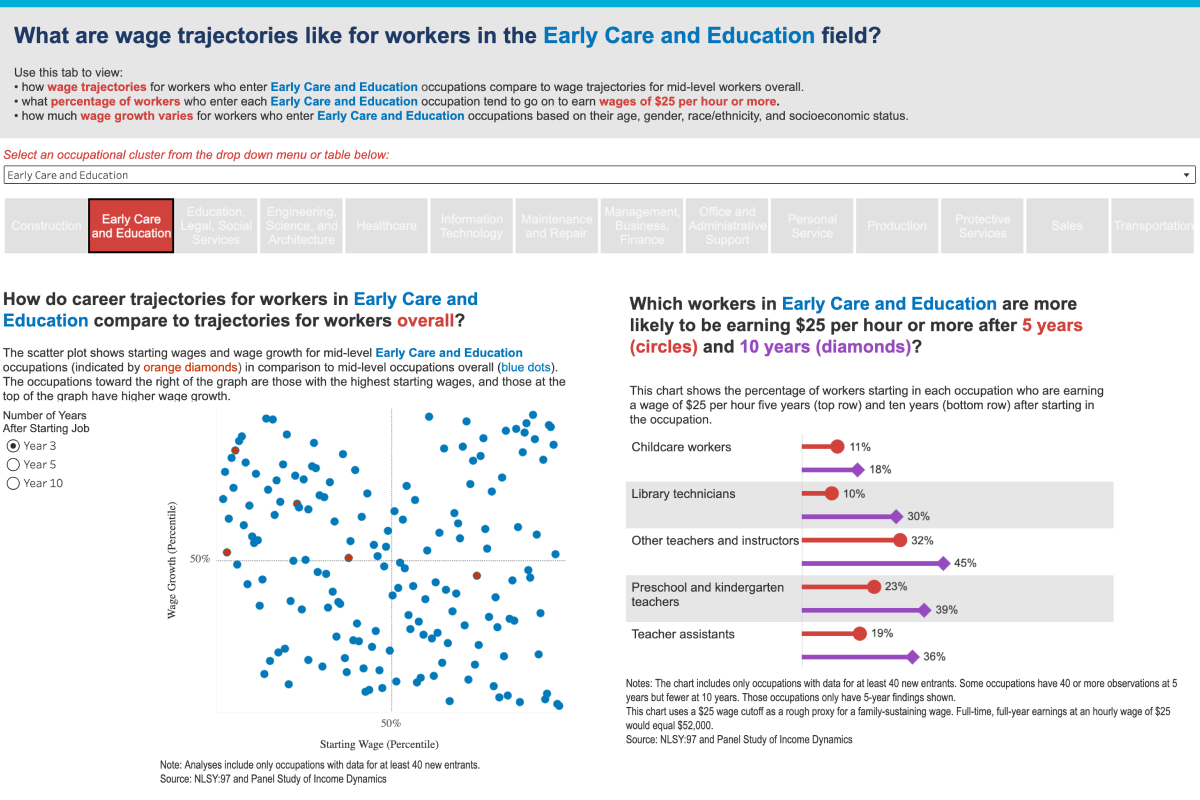
Career Trajectories and Occupational Transitions Dashboard
Abt created the Career Trajectories and Occupational Transitions (CTOT) dashboard for DOL. This interactive tool allows users to view data from four nationally representative longitudinal surveys and online career profiles that capture workers’ career trajectories and transitions as they occur in the labor market.
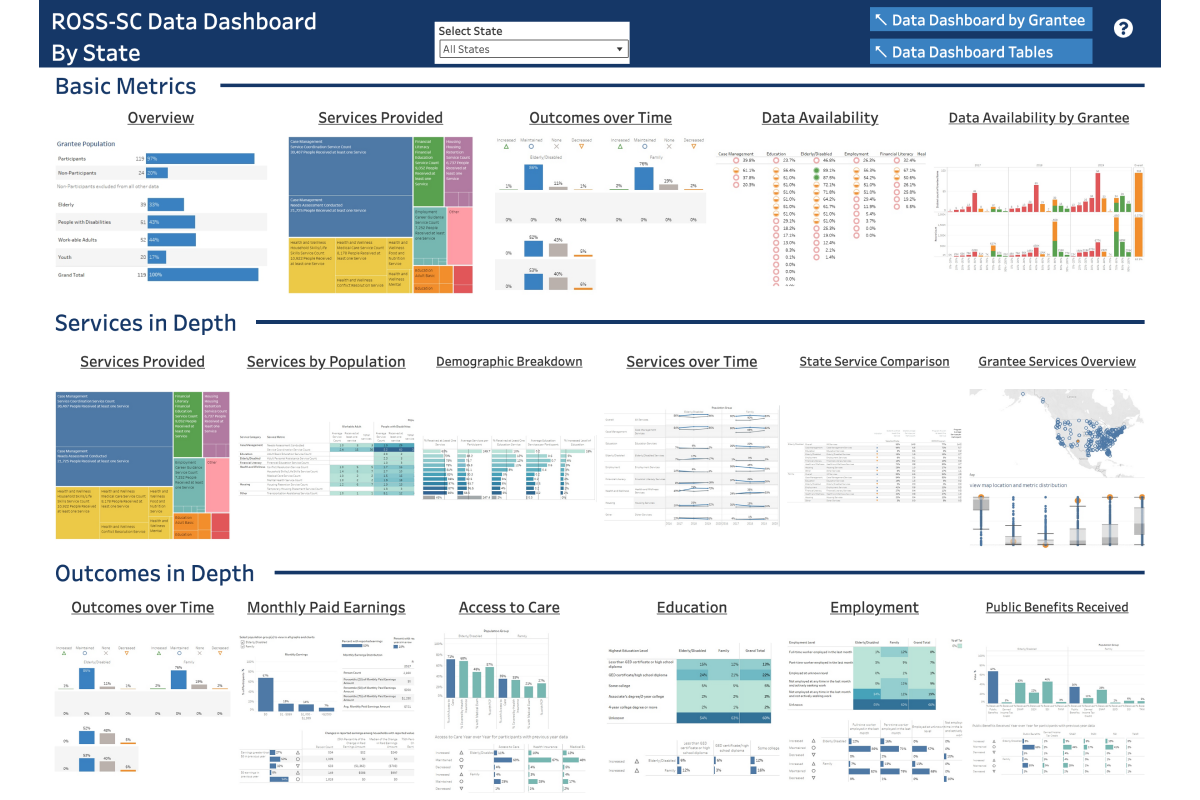
ROSS-SC Data Dashboard
Abt created the ROSS-SC Data Dashboard for HUD and its grantees. This interactive tool allows HUD and ROSS grantees to explore metrics about grantees, the services they provide, and participant outcomes.
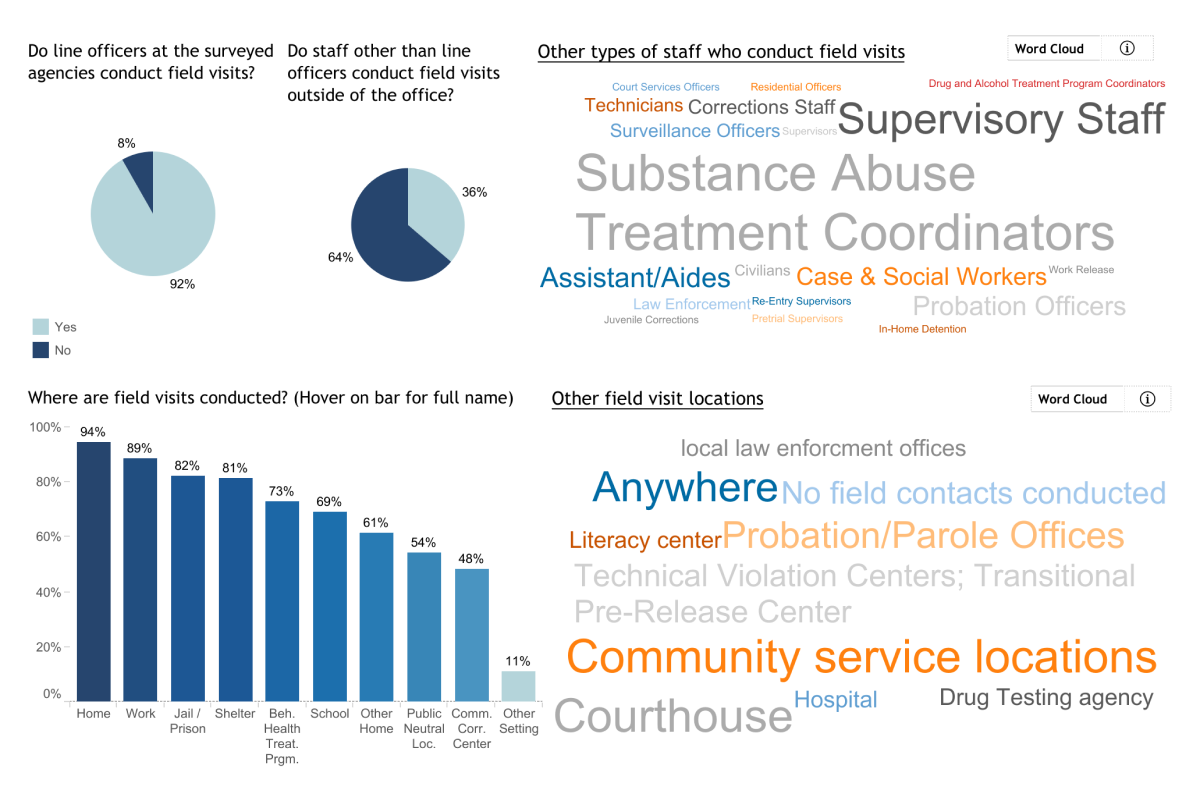
Survey of Home and Field Contact Policies in Community Supervision
Abt created the Survey of Home and Field Contact Policies in Community Supervision dashboard for the National Institute of Justice. The dashboard shares information collected through a survey of more than 300 local and state law enforcement agencies.
Dashboard & Infographics: Survey of Home and Field Contact Policies in Community Supervision